Home prices see biggest gains since 2005, and no bubble in sight
Loading...
| Washington
Home prices in the US have just posted their strongest annual gains since 2005, a new milestone in the recovery of the long-troubled housing market.
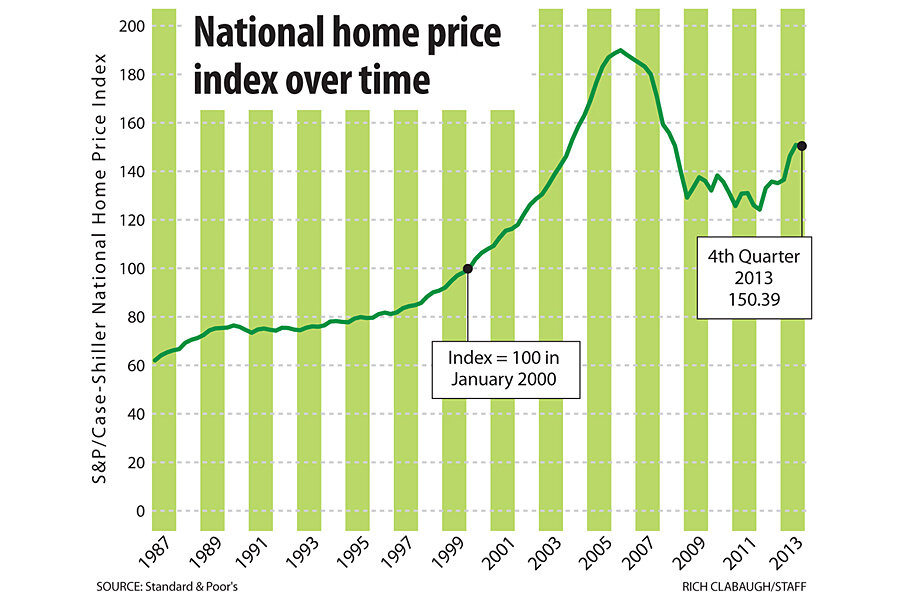
During the past calendar year, home prices rose 11.3 percent in the nationwide Standard/Case-Shiller Home Price Index, according to a report from S&P Tuesday. That rise, the strongest in eight years, brings the index back to levels last seen in early 2004, when a housing boom was in full swing.
That raises the question: Could low interest rates and the fading of foreclosures be starting to fuel another dangerous run-up in home prices?
The short answer is: It’s a risk worth keeping an eye on, but evidence suggests that what’s happening now is a recovery, not a new price bubble.
For one thing, the latest month-to-month numbers are more tepid than booming.
“Gains are slowing from month to month and the strongest part of the recovery in home values may be over,” economist David Blitzer, who chairs the S&P Dow Jones index committee, said in releasing the new numbers.
Separate numbers reported monthly by the National Association of Realtors (NAR) suggest a cooler climate for home prices and a slowdown in the volume of home sales, after a burst of activity last summer.
But if the housing market showed some fourth-quarter weakness, that doesn’t mean its recovery is over, either.
“Going forward, we expect price gains to moderate – but not by much because inventory remains tight, and construction levels remain too low,” writes Patrick Newport, a housing economist at IHS Global Insight, in an analysis of the new S&P Case-Shiller numbers.
In many cities the pool of homes for sale is lean. Across the nation, only a five-month supply of homes is listed for sale, according to NAR tracking. That’s no longer a high level by historical standards. In 2011, about eight months of inventory were on the market as post-recession recovery was still in its early stages.
How high are prices now compared with 2006, when the bubble peaked? Not out of control in most cities.
Las Vegas, for example, has seen strong price gains over the past year, but that market is nowhere near the prices seen back in the bubble days. In Case-Shiller indexes where “100” represents the price level in January 2000, Las Vegas more than doubled to about 235 by mid-2006.
Today the index for the Nevada city is 128.53 (as of the end of last year). That means home prices have gained less than 30 percent in the past 14 years there – not quite keeping pace with inflation of 36 percent in overall consumer prices during that time.
The story in many other cities, too, shows relatively modest prices gains – or modest price losses – relative to inflation since 2000.
Some of the biggest cities do show stronger gains, despite the big declines that came during the 2007-09 recession. Places like San Francisco, Los Angeles, New York, Boston, and Washington are pricey. They weren’t cheap markets in 2000, and now they’re higher still compared with then.
Nationally, even if there’s no new bubble it’s also the case that home prices aren’t cheap.
Still, when you average out the bumpy ride of the past 14 years, the average price gains if anything are a bit slower than they were in the 1990s, according to Federal Housing Finance Agency data.
Daniel Tarullo, one of the governors of the Federal Reserve System, said Tuesday that the Fed is keeping watch against the risk that its low-interest-rate policies could fuel bubbles in assets such as stocks or housing.
For now, though, “valuations for broad categories of assets such as real estate and corporate equities remain within historical norms,” Mr. Tarullo said at a conference of the National Association for Business Economics in Washington.


